Getting started
Platform overview, quick-start, login flow, and a tour of the dashboard.
Platform Overview
CloudWady is a professional deployment platform that automates the provisioning, deployment, and management of Odoo applications. It integrates cloud providers, Git repositories, infrastructure automation, and real-time monitoring into a unified dashboard.
Key Capabilities
- Multi-Environment Projects: Organize deployments into Production, Staging, and Development environments.
- Automated Deployments: One-click deploy, update, backup, and restore — fully automated, no manual server commands.
- Git Integration: Connect GitHub repositories via GitHub App for automatic branch tracking and webhook-triggered deployments.
- Cloud Provisioning: Auto-provision servers on Hetzner, DigitalOcean, with Cloudflare DNS and SSL management.
- Real-Time Monitoring: Embedded Grafana dashboards for CPU, memory, disk, network metrics, and application logs.
- Alerting System: Proactive backup, SSL, server cleanup, and core addons update alerts with integration channels (Email, PagerDuty, OpsGenie, webhooks).
- Role-Based Access: Granular per-company permissions from Viewer to Admin with environment-specific controls.
Quick Start Guide
Get your first Odoo application deployed in minutes:
- Log in to the Dashboard - Access your CloudWady dashboard. You will land on the main Overview screen.
- Create a Project - Navigate to a project and use "New Deployment App" in the environment toolbar, or use the project creation wizard to set up a complete project with server and environment.
- Review Your Project - Once created, the project dashboard shows your environments (Production, Staging, Development) with server metrics and app cards.
- Configure Your App - Open the app to set the Odoo version, edition, Git branch, and environment variables.
- Deploy - Click the Deploy button. CloudWady builds and deploys your application automatically.
- Monitor - Watch deployment progress in real-time via workflow logs. Once complete, click "Open" to access your running Odoo instance.
Login & Onboarding
Access the CloudWady platform through the login page. New users are guided through terms acceptance before reaching the dashboard.
https://your-domain.com/web/login).
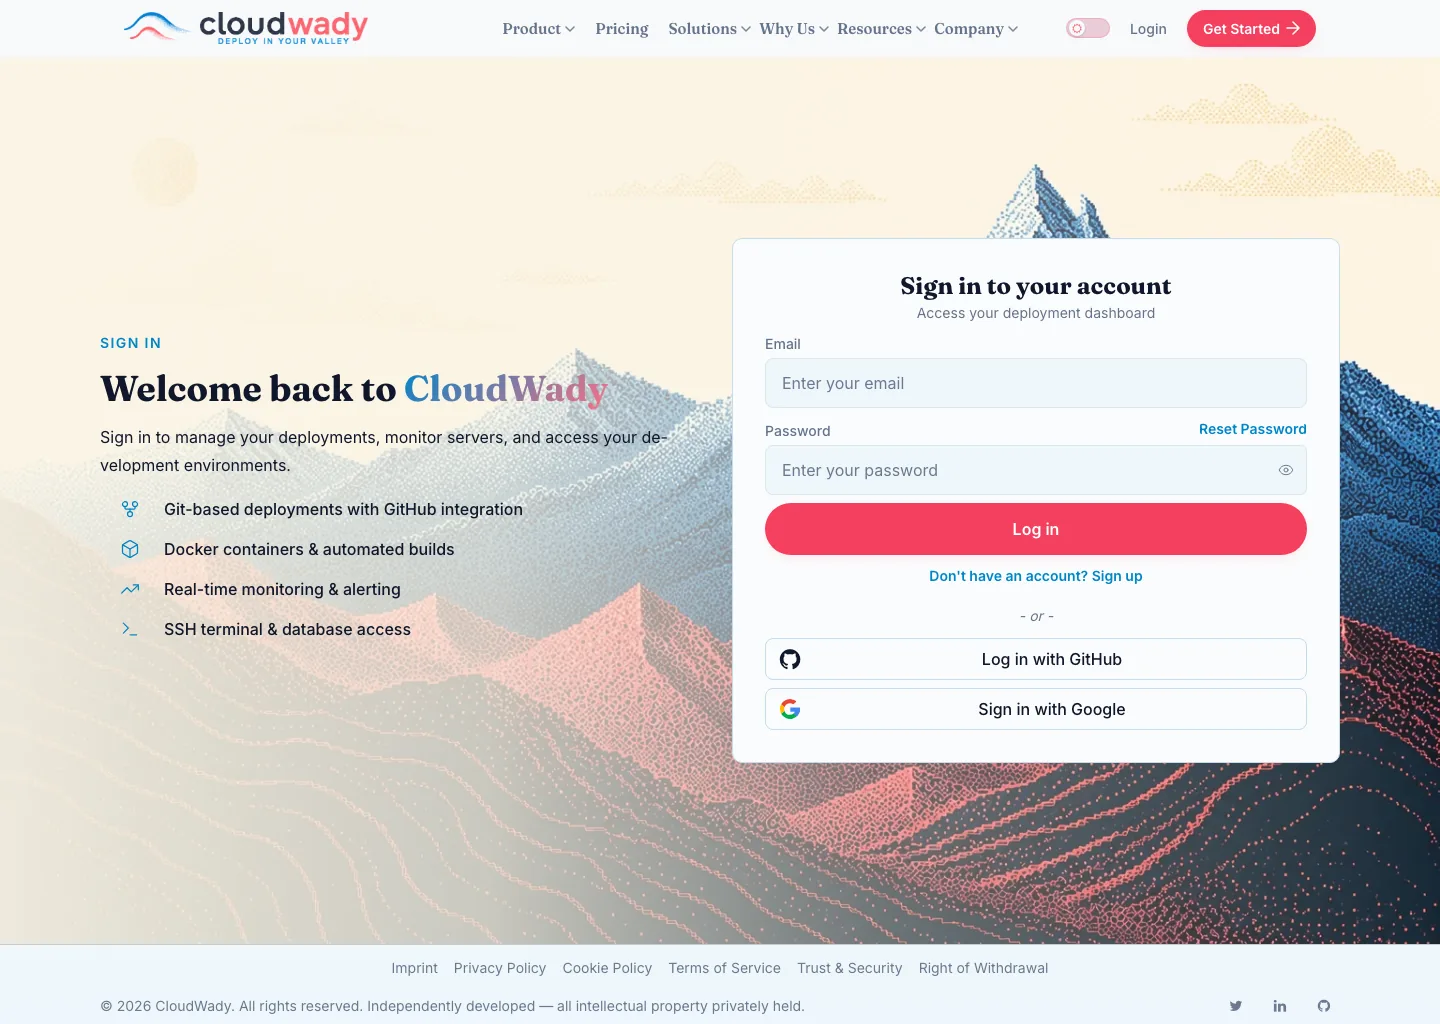
- Email & password — enter the credentials your administrator issued, then Log in.
- Reset Password — request a reset link if you've forgotten your password.
- Log in with GitHub / Sign in with Google — single sign-on, when enabled for your instance.
Login Methods
- Email & Password: Enter your email address and password in the login form.
- GitHub OAuth: Click "Log in with GitHub" to authenticate via your GitHub account (requires GitHub App integration).
Common Tasks
Logging In for the First Time
- Open the Login Page - Navigate to your CloudWady URL. You will see the login form with email and password fields.
- Enter Credentials - Fill in the email and password provided by your administrator.
- Accept Terms - On first login, you will be presented with the Terms and Conditions. Scroll through the full document, check the acceptance checkbox, and click "Accept".
- Dashboard Landing - After acceptance, you land on the main deployment dashboard.
Understanding the Dashboard
The main dashboard is your command center, providing a high-level overview of your entire platform.
/deployment/dashboard?menu=overview
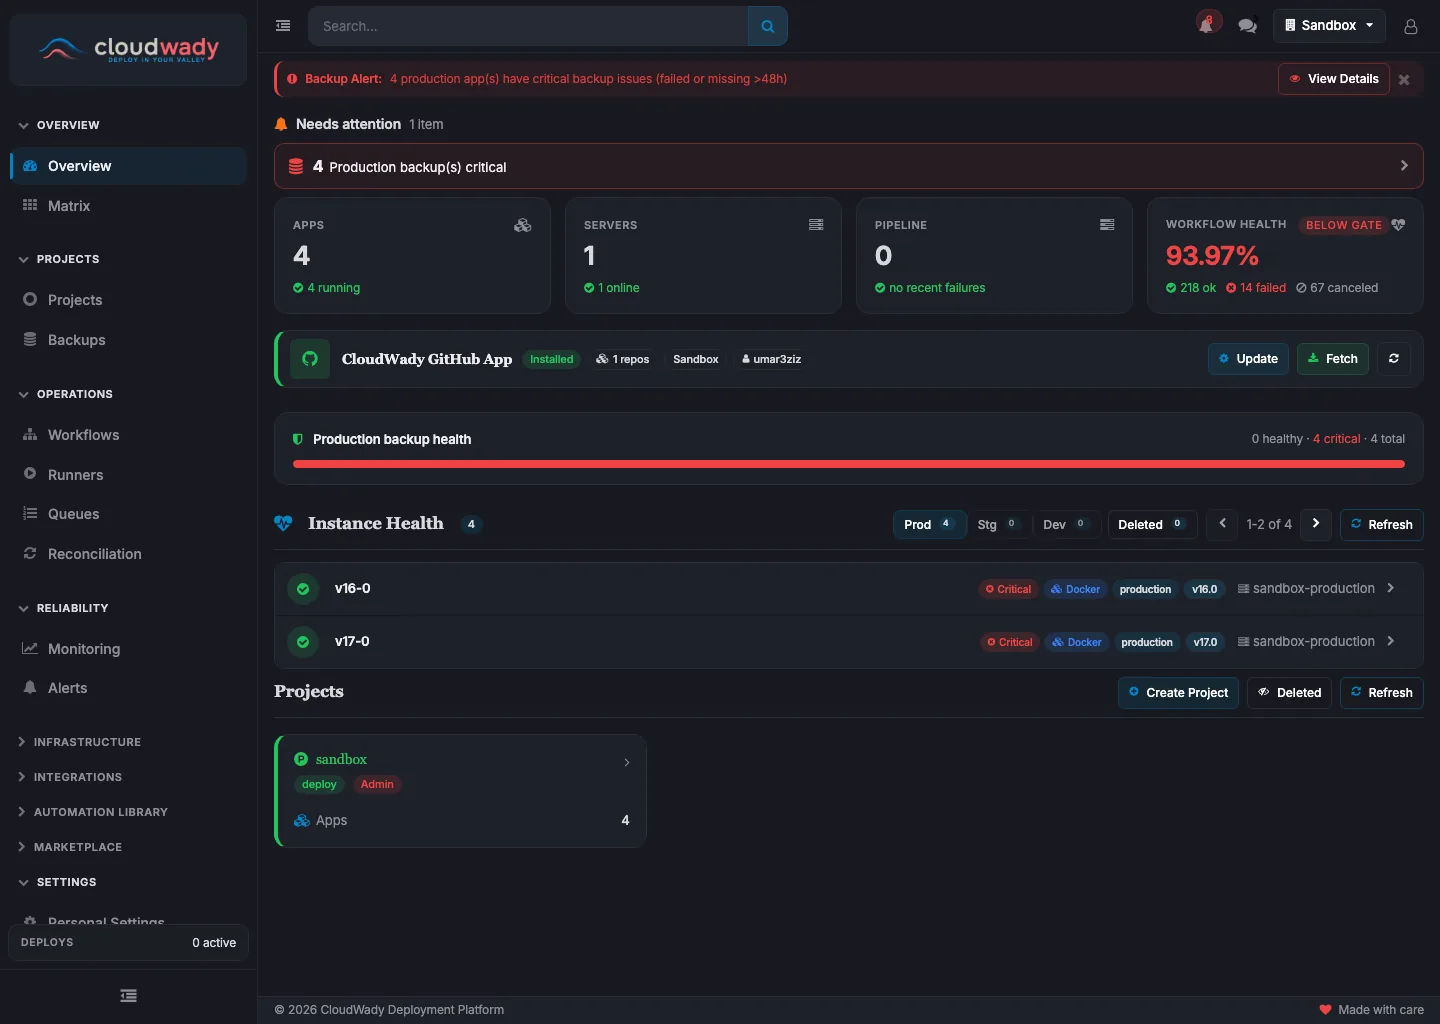
- Sidebar — grouped navigation (Overview, Projects, Alerts, Health, Backups, Operations, and more).
- Attention banners — backup alerts and other items needing action surface at the top.
- Stat cards — Apps, Servers, Pipeline runs, and Workflow Health at a glance.
- Instance Health — per-environment status of every running app, filterable by stage.
Dashboard Sidebar
The left sidebar groups the platform into sections. The everyday destinations at the top — Overview, Projects, Alerts, Health, Backups and Operations — are visible to everyone; the infrastructure and automation sections require maintainer access. Screens about one subject are one menu with tabs (Health, Operations, Billing & Plans, Namespace), and an old link to one of the former screens still opens its tab. Your own profile and notifications are under My Settings in the avatar menu.
| Section | Menu items | What it's for | Min. role |
|---|---|---|---|
| Workspace | Overview, Projects, Alerts, Health, Backups, Operations | Platform summary, your projects, the alert inbox, platform health (status matrix, backups, URLs, servers and core add-ons as tabs), the backup catalog, and Operations — workflows, runners, queues and reconciliation as tabs. | All |
| Infrastructure | Servers, Storage, Installers | Provisioned servers, storage boxes, and platform installers. | Maintainer |
| Integrations | Cloud Providers, Domains, Git Providers, Git Repositories | Hetzner/DigitalOcean, Cloudflare DNS, the GitHub App, and connected repositories. | Maintainer |
| Overrides | Templates, Playbooks | Your own versions of the platform's Jinja templates and Ansible playbooks (White Label). | Maintainer |
| Settings | Team & Access, Billing & Plans, Namespace | Team permissions; billing and add-on subscriptions (tabs); namespace configuration and white-label branding (tabs). | Maintainer / Admin |
Status cards & attention banners
Across the top are at-a-glance cards — Apps (with how many are running), Servers (online count), Pipeline (recent automation failures), and Workflow Health (success rate, flagged Below Gate when it dips under the threshold). Above them, attention banners surface anything that needs action, such as production backups that are failing or stale.
Backup health & Instance Health
A backup-health bar summarizes how many production apps have healthy versus critical backups. Below it, the Instance Health list shows every running app grouped by environment (Production, Staging, Development) with its runtime, version, and namespace, and is filterable by stage.
GitHub App integration
When the GitHub App is connected, a card shows the app, an Installed badge, the number of linked repositories, the company, and the connected GitHub account — with Update and Fetch actions to re-sync.
Available Actions
| Action | Description | Access Level |
|---|---|---|
| GitHub App: Update | Sync GitHub App data and repositories | Maintainer |
| GitHub App: Fetch | Fetch latest repository info from GitHub | Maintainer |
Was this page helpful?
Your answer helps us prioritize documentation improvements.
Thanks — your feedback helps us improve.